Brand New UX Dashboard
By Asaf Shamly | April 18, 2022

For the first time ever, uncover how your monetization strategy directly impacts your UX and find the perfect UX/Revenue balance.
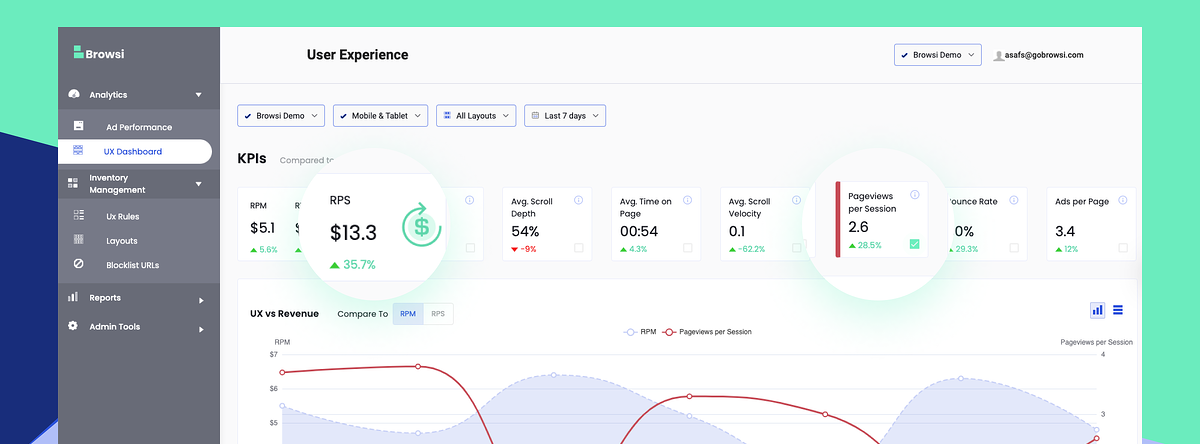
You can now see in one slick dashboard how your UX KPIs and your Revenue KPIs correlate. No more shooting in the dark and upsetting your Editorial team, ensure that every ad-related decision also improves your UX.
 Track your UX and Revenue KPIs
Monitor all your UX metrics such as pageviews per session, average scroll depth, average time on page and see their correlation with your RPM and RPS.
 Analyze your UX per individual layout
Understand how each of your different ad layouts affect the users’ behaviors AND your revenue to adapt your monetization strategy accordingly.
 Find your UX/Revenue sweet spot
Pinpoint the perfect UX/Revenue balance and never settle again for less revenue to protect your UX or for bad UX to grow your revenue!
Tired of having no visibility into how your ad layout impacts your UX?
Schedule your demo now and we’ll be more than happy to show you our new UX dashboard and how you can get the best of both worlds, increased revenue AND improved UX.
Latest Articles
-

Do NOT make me choose between a great UX and boosting my revenue!!
The ongoing clashes between revenue, product, and editorial teams are painful to say the least. It doesn’t have to be this way.
View Now -

Your Brand New Viewability Dashboard!
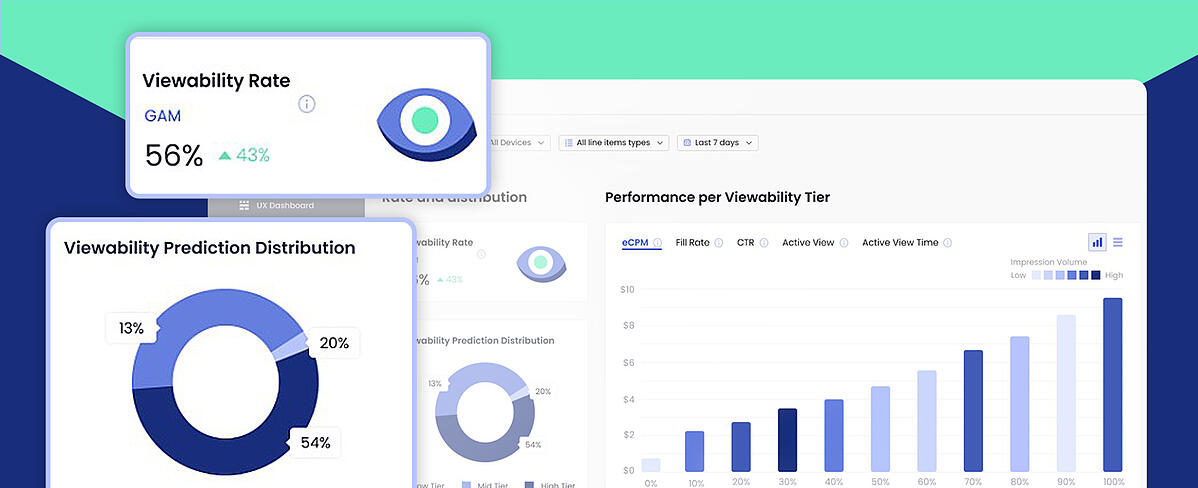
Understand your inventory breakdown with the new Viewability Dashboard.
View Now -

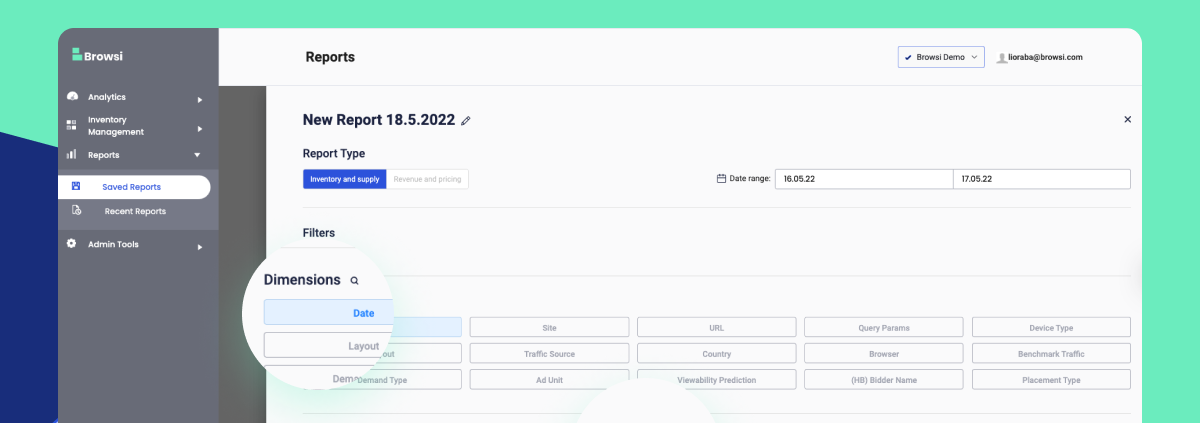
Maximize Your UX & Revenue Data With Personalized Reports
Ready to uncover insights and step up your ad layout strategy?
View Now
